|
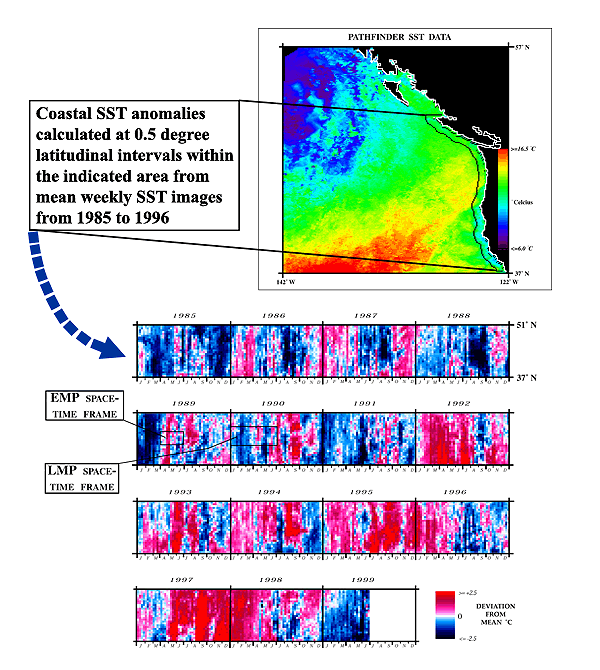
Figure 3. Derivation of SST anomalies from a time series of mean weekly SST images. An example image shows the coastal area from which the SST anomalies were calculated (a), and the space-time frames for the Early and Late Marine Phases (EMP and LMP) for the 1989 ocean-entry year class illustrated with the anomalies (b). |
