|
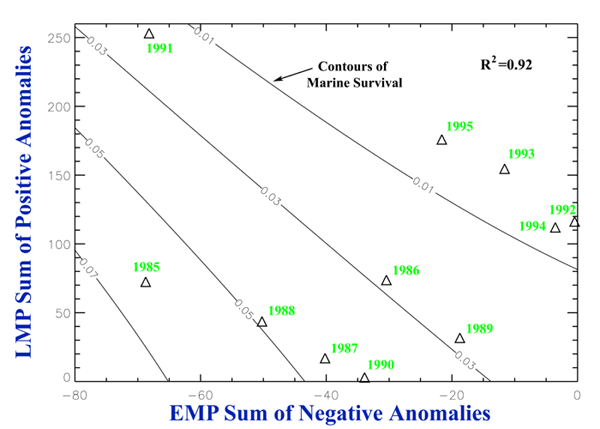
Figure 5. The sum of EMP negative anomalies plotted against the sum of LMP positive anomalies. Contours corresponding to different levels of marine survival were generated from a non-linear multiple regression which accounted for 92% of the overall variation in survival. |
